This Fascinating Map Shows Which American States Are the Most Unhappy

Happiness levels in nearly half of US states are down, according to a new study.
The study by research organisation Gallup and healthcare information service Sharecare took into account survey results from more the 2.5 million Americans and examined how people felt in their everyday lives. Categories surveyed included health and wellness, having positive and supportive family and friend relationships, economic and financial security, feeling connected to one’s community, and having an overall sense of purpose in life.


The results show a nation whose happiness is in decline. The Gallup-Sharecare Well-Being Index has tracked the same data for 10 years, and the stats from 2016 to 2017 show the largest yearly drop so far. Twenty-one states registered declines in their levels of well-being, and no states at all showed a statistically significant improvement in 2017.
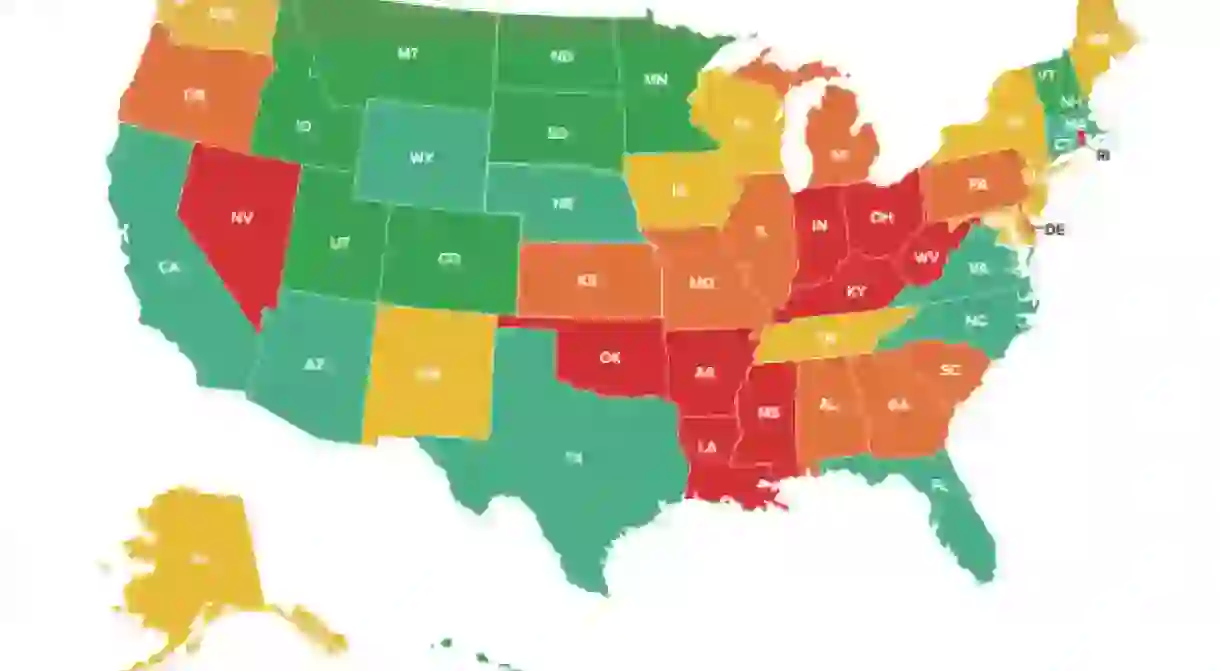
The map shows these results in colour for every state, with red meaning the lowest well-being levels and green meaning the best. A strip of unhappiness reaches from Ohio and Indiana down into West Virginia, which is the state with the lowest level of well-being. This belt reaches south into Arkansas, Oklahoma, Mississippi and Louisiana. Other states with a low sense of well-being include Rhode Island and Nevada.

More positively, there’s a section of the nation that reports higher levels of well-being. North and South Dakota, Montana, Idaho, Colorado, Utah, Vermont, New Hampshire, and Hawaii are all doing relatively well in terms of well-being. South Dakota is the state that reports the highest levels altogether.
Although the report did not provide any analysis on why there has been a decline in happiness, it did offer recommendations for employers, state and community leaders, and other stakeholders to help improve well-being.


