This Map Shows Exactly How Polluted the Earth Is

Images taken by the European Space Agency (ESA) show the pollution levels across the world – and the amount of it will shock you.
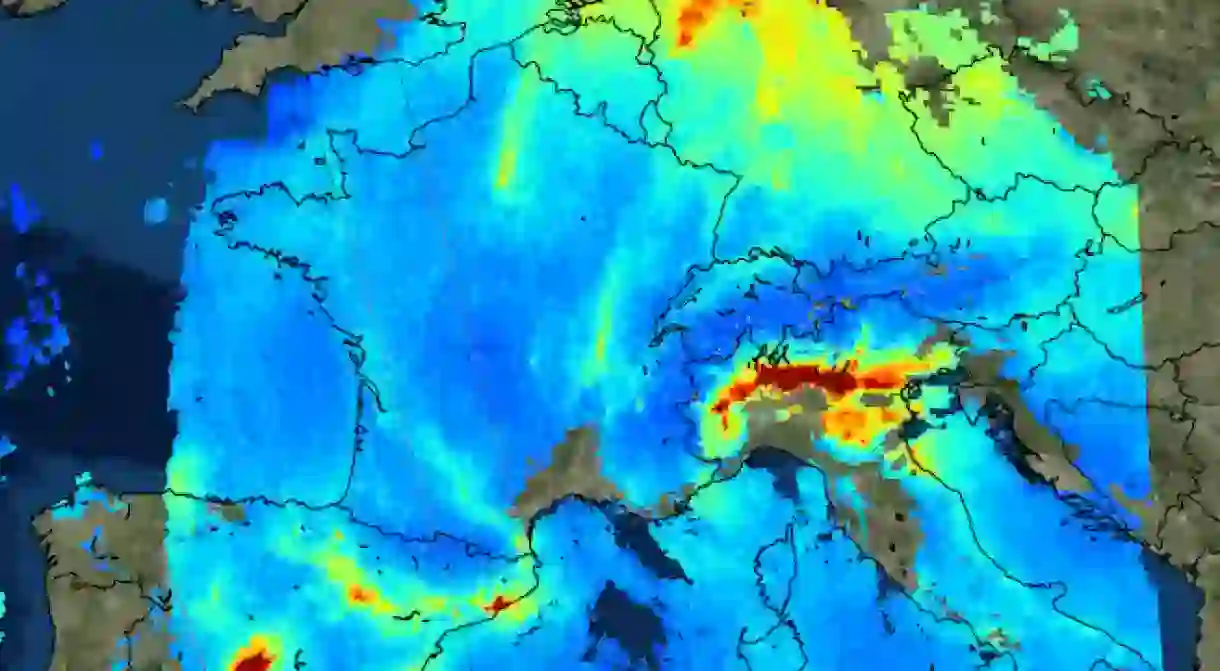
The images, taken by the agency’s Sentinel-5P satellite, show the amount of air pollutants around the world on November 22, and displayed high nitrogen dioxide pollution levels in Europe plus an exploding volcano in Bali.
Sentinel-5P, which was launched on October 13, is able to map the levels of carbon monoxide, methane, nitrogen dioxide and other air pollutants hazardous to human health or contributing to global warming.

The picture shows a planet that is being slowly choked by pollution.
The nitrogen dioxide in Europe is caused mainly by emissions from vehicle and industrial processes, and is especially apparent over western Germany, the Italian Po Valley, the Netherlands and areas of Spain.
High levels of carbon monoxide levels are visible over areas of Asia, South America, and Africa, and are commonly produced by fires.


Amazingly, the satellite has picked up also show sulphur dioxide, ash and smoke from the erupting Mount Agung volcano in Bali last month.
Speaking to the Mail Online, Josef Aschbacher, ESA’s Director of Earth Observation Programmes, said: ‘Sentinel-5P is the sixth satellite for the EC Copernicus environmental monitoring programme but the first dedicated to monitoring our atmosphere.
‘These first images offer a tantalising glimpse of what’s in store and are not only an important milestone for the Sentinel-5P mission, but also an important milestone for Europe.
‘Data such as we see here will soon underpin the Copernicus Atmosphere Monitoring Service, and will be used to issue forecasts, and will ultimately be valuable for helping to put appropriate mitigation policies in place.’
The ESA say that the satellite images provide the most detailed look at worldwide air pollutants, and the sensor used to record them is the most sensitive of its kind of date.


